
Global surface air temperature anomaly 2025 (ERA5)
1.47 °C above baseline
2025 · 1850-1900
Copernicus Climate Change Service (C3S) · Global Climate Highlights 2025 / press release
Research library · updated 24 October 2026
The latest figures from the world's climate agencies and assessment reports, in plain language, each linked to its source.

2026 so far (January to month 9): +1.23 °C against the same baseline.
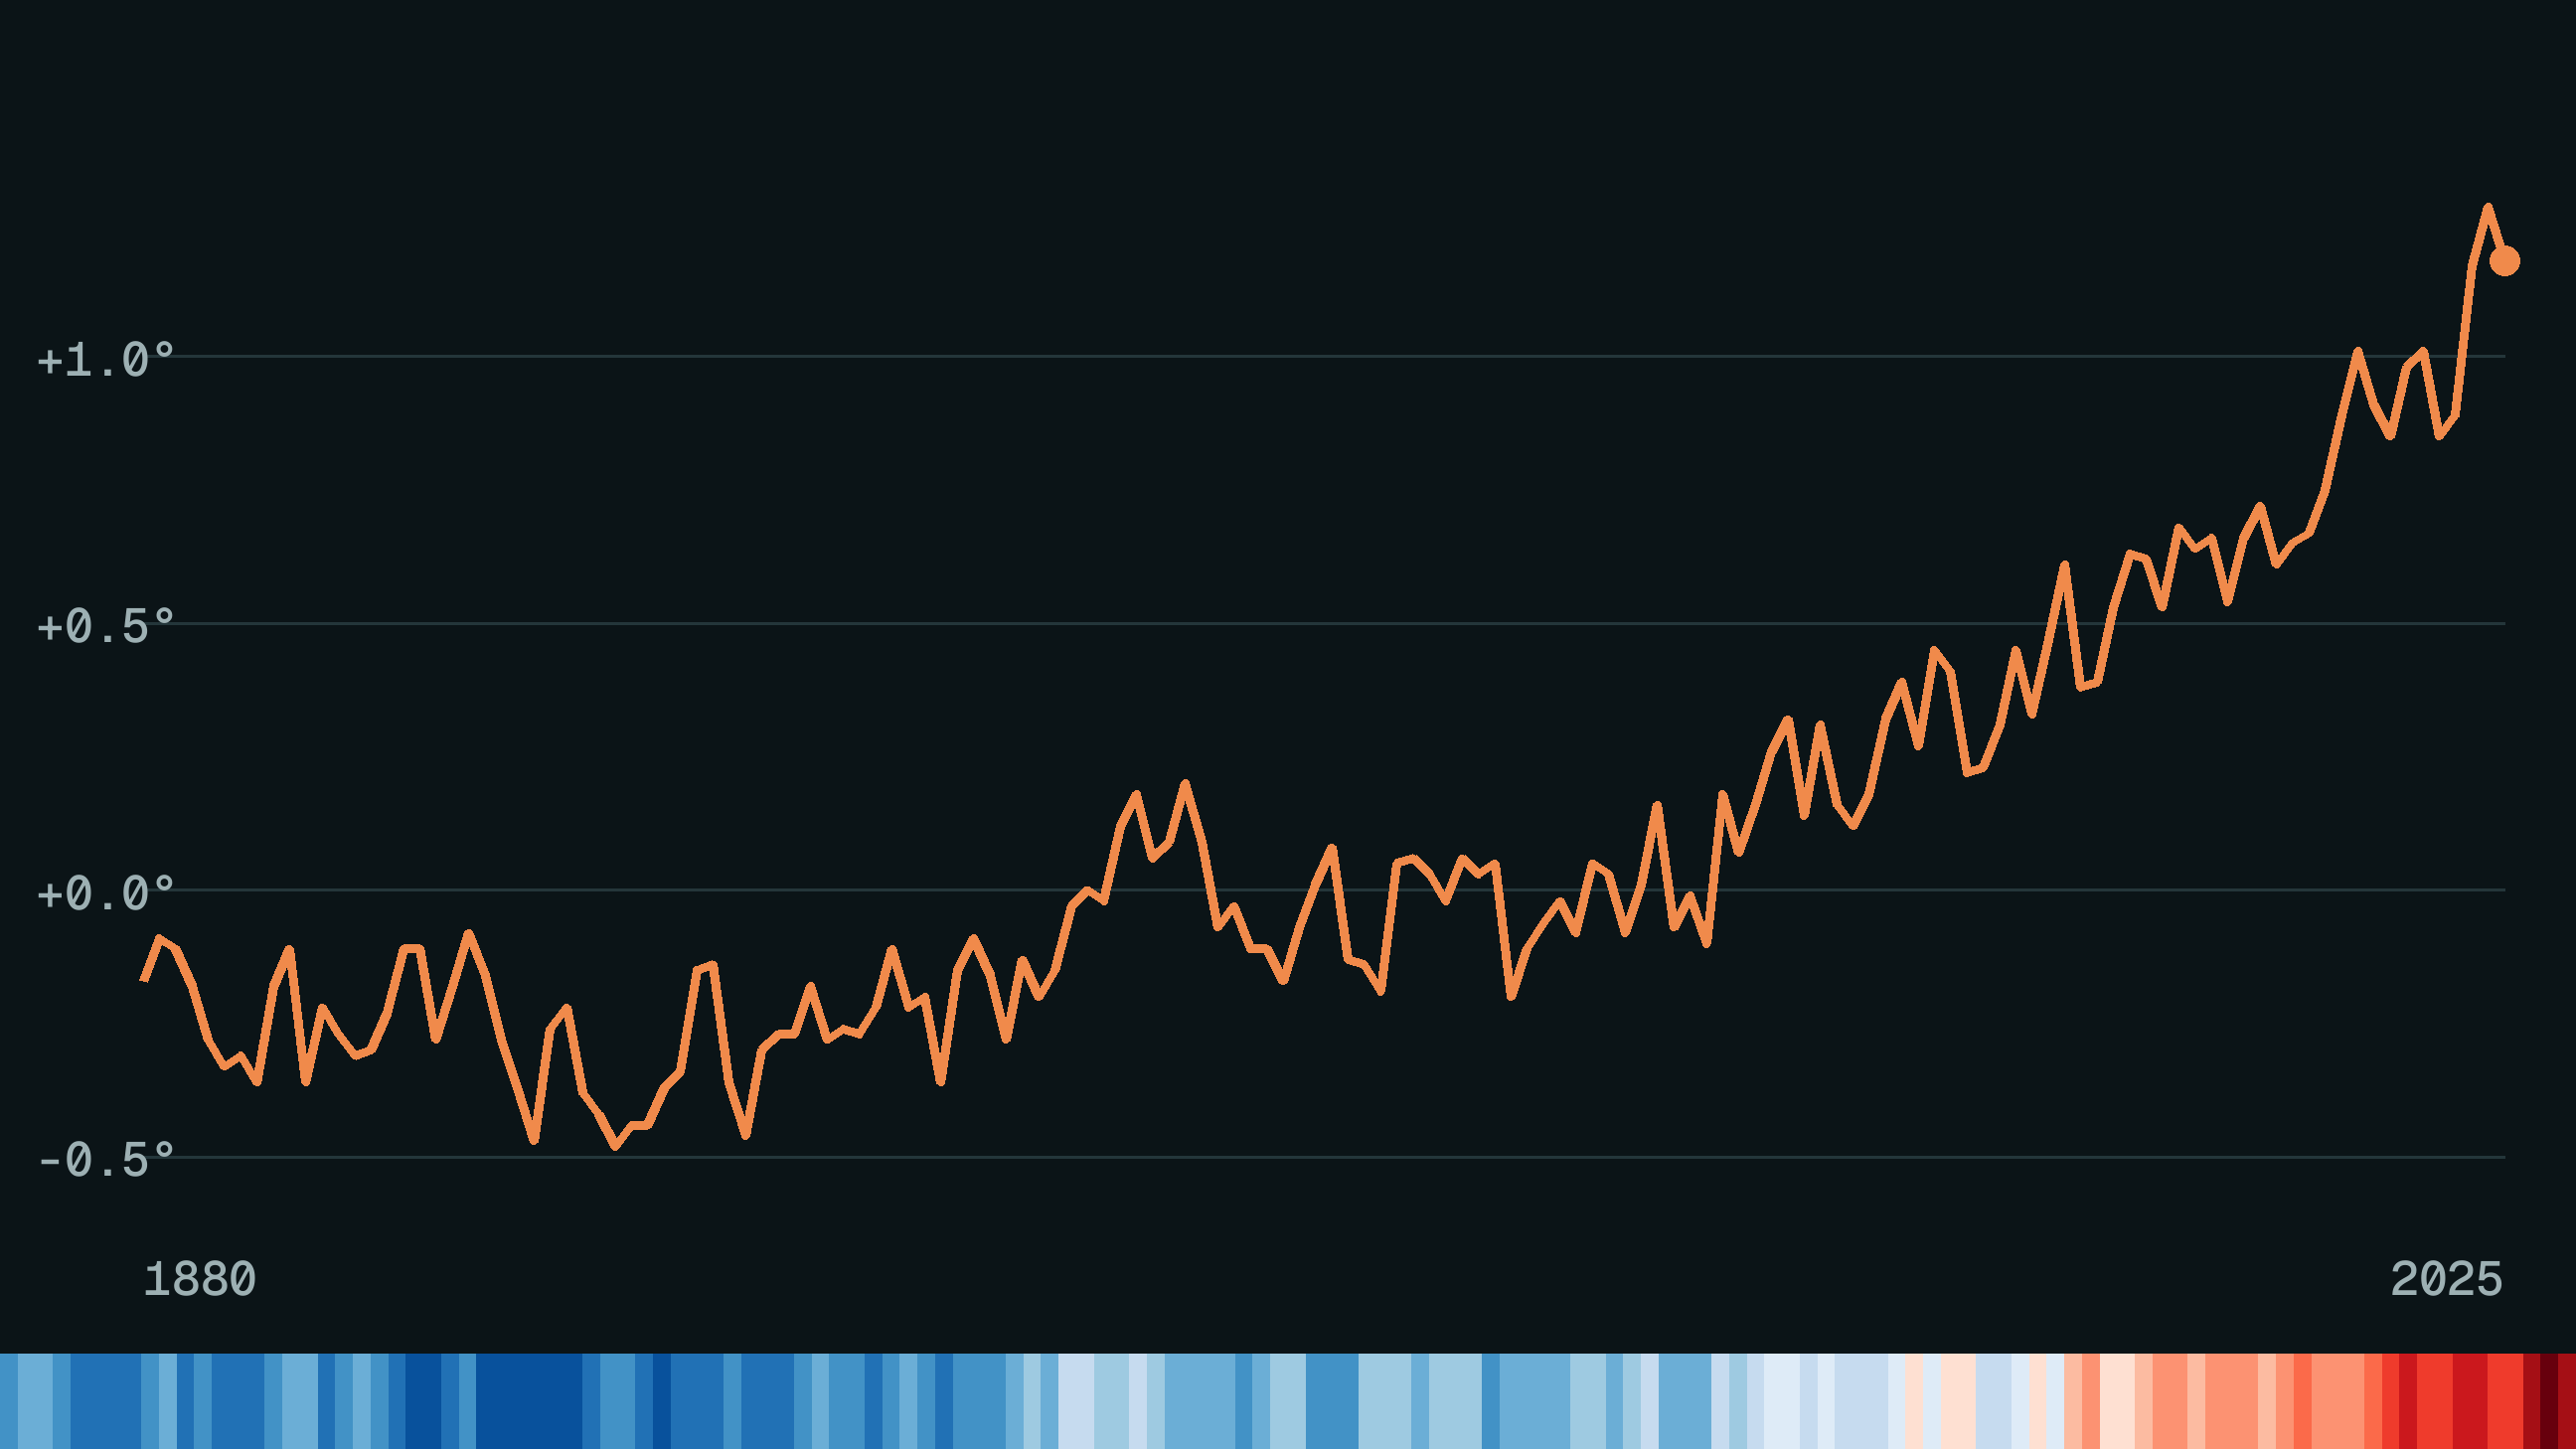
Global surface air temperature anomaly 2025 (ERA5)
1.47 °C above baseline
2025 · 1850-1900
Copernicus Climate Change Service (C3S) · Global Climate Highlights 2025 / press release
Global mean temperature 2025 (consolidated, 8 datasets)
1.43 °C above baseline (±0.13)
2025 · 1850-1900
World Meteorological Organization · State of the Global Climate 2025
Global temperature anomaly 2025 (GISTEMP)
1.19 °C above baseline
2025 · 1951-1980
NASA · NASA releases global temperature data
Global temperature anomaly 2025 (NOAAGlobalTemp)
1.17 °C above baseline
2025 · 20th-century average
NOAA NCEI · Global Climate Report - Annual 2025
Global temperature anomaly 2025
1.44 °C above baseline (±0.09)
2025 · 1850-1900
Berkeley Earth · Global Temperature Report for 2025
Monthly anomaly September 2026
1.63 °C above baseline
2026-09 · 1850-1900
Copernicus Climate Change Service (C3S) · Monthly climate bulletin
CO2 at Mauna Loa, latest monthly mean
426.07 ppm
2026-09 · Sep 2025: 424.37 ppm
NOAA Global Monitoring Laboratory · Trends in Atmospheric CO2
Methane (global monthly mean)
1934.57 ppb
2026-06 · Jun 2025: 1929.17 ppb
NOAA Global Monitoring Laboratory · Trends in Atmospheric CH4
Nitrous oxide (global monthly mean)
339.86 ppb
2026-06 · Jun 2025: 338.68 ppb
NOAA Global Monitoring Laboratory · Trends in Atmospheric N2O
Fossil CO2 emissions 2025
10.4 GtC
2025 · 2024: 10.3 ±0.5 GtC
Global Carbon Project · Global Carbon Budget 2025
Human-induced warming 2025
1.37 °C above 1850-1900
2025 · 1850-1900
Forster et al. / IGCC · Indicators of Global Climate Change 2025
Human-induced warming rate
0.27 °C per decade (likely 0.2-0.4)
2016-2025
Forster et al. / IGCC · Indicators of Global Climate Change 2025
Greenhouse gas emissions (all gases)
56.8 GtCO2e
2024 · 10-year mean 2015-2024: 54.6 ±5.5
Forster et al. / IGCC · Indicators of Global Climate Change 2025
Global mean sea level rise in 2025
0.08 cm in the year (0.59 cm in 2024)
2025 · Since 1993: about 10 cm
NASA · La Nina limited sea level rise in 2025
Sea level rise rate
4.1 mm per year
2016-2025 · 1993-2002: 2.1 mm/yr
World Meteorological Organization · State of the Global Climate 2025
Ocean heat content trend
11.0-12.2 ZJ per year
2005-2025
World Meteorological Organization · State of the Global Climate 2025
Arctic sea ice minimum 2026
4.6 million km²
2026-09-12
NASA / NSIDC · Arctic sea ice 2026 minimum
Antarctic sea ice maximum 2026
18.19 million km²
2026-09-10
Copernicus Climate Change Service (C3S) · Monthly climate bulletin September 2026
Projected warming if NDCs fully implemented
2.3-2.5 °C by 2100
NDCs as of 2025 · Previous edition: 2.6-2.8 °C
UNEP · Emissions Gap Report 2025
Warming projected from current policies
2.6 °C by 2100
2025
Climate Action Tracker · Global Update 2025
Reef area hit by bleaching-level heat stress (4th global event)
84 percent
2023-01 to 2025-06
NOAA NESDIS / Coral Reef Watch · World's fourth mass coral bleaching event likely ended
IPCC · 2023-03-20
IPCC · 2025-08-18
WMO · 2026-03-23
Copernicus Climate Change Service · 2026-01-14
Global Carbon Project · 2026-05-13
UNEP · 2025-11-04
Forster et al., Earth System Science Data · 2026-06-11
The Lancet / Lancet Countdown · 2025-10-29
American Meteorological Society / NOAA · 2026-08-10
Climate Action Tracker · 2025-11-13
| Dataset | Publisher | What it measures | Updated |
|---|---|---|---|
| ERA5 reanalysis | Copernicus C3S / ECMWF | Hourly global atmosphere, land and ocean fields since 1940 | monthly bulletin, daily data with about 5-day lag |
| GISTEMP v4 | NASA GISS | Global surface temperature anomalies since 1880 | monthly |
| NOAAGlobalTemp | NOAA NCEI | Merged land-ocean temperature record | monthly |
| Berkeley Earth Land/Ocean | Berkeley Earth | Independent global temperature series | monthly |
| HadCRUT5 | UK Met Office Hadley Centre / UEA CRU | Gridded temperature anomalies | monthly |
| Mauna Loa CO2 / global CO2 | NOAA GML | Atmospheric CO2 daily to annual | daily to monthly |
| Keeling Curve | Scripps Institution of Oceanography | Mauna Loa CO2 record since 1958 | daily |
| NOAA greenhouse gas CH4 and N2O trends | NOAA GML | Global methane and nitrous oxide | monthly |
| Global Carbon Budget data | Global Carbon Project | Emissions, sinks and budget by country | annual (November) |
| Indicators of Global Climate Change data | Forster et al. via Zenodo | Warming, forcing, budget indicators | annual (June) |
| Sea Ice Index | NSIDC | Daily and monthly Arctic and Antarctic ice extent | daily |
| NASA Sea Level Change portal | NASA | Satellite altimetry global mean sea level | about every 2 months |
| Fluctuations of Glaciers | World Glacier Monitoring Service | Glacier mass balance and length change | annual |
| IMBIE ice sheet mass balance | IMBIE / ESA-NASA | Greenland and Antarctic mass balance | irregular editions |
| Coral Reef Watch | NOAA | Satellite heat stress and bleaching alerts | daily |
| EDGAR | European Commission JRC | Global emissions by country and sector | annual |
| Argo ocean data | Argo programme | Profiling float temperature and salinity | continuous |
We take every figure from the publishing agency or report, name the period and baseline, and link the source. Different agencies use different baselines, so their numbers are not added or mixed. Summaries are our own words.
Free · every Monday
One email on Monday morning: the projects, studies and policy moves that mattered, each in a few plain sentences with a link to the source.